I’ve been trying out IronPython 2.7 beta 1, which includes Visual Studio 2010 integration and I’ve been very impressed. Here’s a brief rundown of the features (at least the ones I’ve found).
Project Templates
Four new project templates are included – these are a Console Application, a WinForms application, a WPF application and finally a Silverlight web page. The templates each have just enough code to get you started.
The Code Editor
As you might expect there is syntax highlighting for Python files:
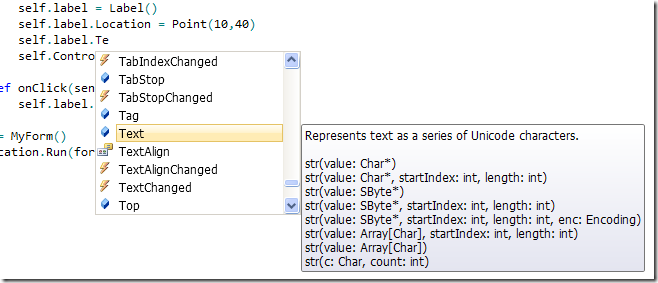
Another nice touch is that pressing backspace with the cursor at the start of a line of code moves it in one level of indentation. What I wasn’t expecting was intellisense, but it’s available in some places (though not everywhere since the dynamic nature of Python means you can’t guarantee that a variable will keep the same type that it was initially assigned).
Another nice touch is red squiggly lines indicating syntax errors – very useful if like me you keep forgetting the colon at the end of if statements:
Also the Navigation Bar is populated with the classes and methods in your source file:
Another very nice touch is that the Find All References and Go To Definition both work. Also the Object Browser includes classes and methods from your IronPython source files.
Solutions
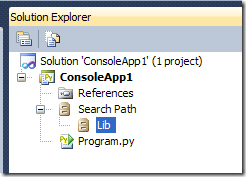
When you create an IronPython project it creates a regular .sln file, but your project is a .pyproj file (which like .csproj is an msbuild project file under the hood). It doesn’t have too many configuration options, but it does allow you to add search paths for external python scripts or .NET libraries. You can also specify which your startup file is.
Search Path can also be configured in the Solution Explorer:
The Debugger
One of the most compelling reasons to use Visual Studio to write your IronPython apps is support for the debugger. You can set breakpoints and step through your code:
Sadly tooltips showing the values of variables don’t seem to be implemented. The only tooltips I could get up was by hovering over the open quotes of a string literal. Also you can’t get at variable contents using the Immediate or Watch windows. Neither can you use Python variables or expressions for breakpoint conditions.
However, the Locals window does come to the rescue and can be used to examine the contents of variables while you are at a breakpoint.
The IronPython Interactive Window
Another great feature is the IronPython Interactive Window. This is the same old familiar interactive IronPython interpreter you get when you type ipy.exe, except that it has a few tricks up its sleeve. It supports both syntax highlighting and intellisense, which works even better here since it can look at the live objects rather than having to analyse your source code.
There is an option on the debug menu to execute your application in IronPython Interactive:
This brings up the IronPython interactive window and attempts to run your project in it. You can even change scope, and investigate the value of variables in the various scopes of the different modules of your application. Here’s it running the simple test app I showed earlier:
There are still a couple of issues using this for debugging. First, it doesn’t apply the Search Path to the interactive session so import statements fail. Second, running in this mode doesn’t seem to invoke the debugger, so you won’t stop at breakpoints. Hopefully these issues will be addressed in a future update of the tools.
Another nice feature is the ability to select IronPython code in the editor, right-click it and say – Send to Interactive. You need to be on a blank line in the interactive console though or it can get a bit confused. But this is a great way to get longer functions into the interactive window.
Conclusion
The Visual Studio support for IronPython is very impressive. It still needs a few enhancements, particularly in the area of debugging, but there are still plenty of advantages to using Visual Studio for IronPython development over simply working directly with files.
Since this post is fairly long, I’ll save comments on Silverlight with IronPython for another time.


1 comment:
Very useful information. Thanks.
Post a Comment